Customers now expect dashboards inside the software they already pay for. They don't want a CSV export and a spreadsheet. In 2026, Fortune Business Insights valued the global embedded analytics market at $26.88 billion, and it projects 15.68% annual growth through 2034 (Embedded Analytics Market report).
The hard part is picking from dozens of embedded analytics tools. Most of the big names were built as internal BI platforms, and their pricing shows it. Per-viewer licenses, capacity nodes and sales-only quotes can turn a simple customer dashboard into a six-figure line item.
This guide compares Draxlr with nine established enterprise platforms. For each one you'll see how embedding works, what it really costs and who it suits.
Key Takeaways
- Draxlr is the most affordable pick here: embedding starts at $75/month with unlimited external viewers.
- Six of the nine enterprise tools don't publish embedded pricing. Vendr's buyer data puts median contracts for Domo, Sisense, Sigma and ThoughtSpot at $50,000–$100,000 a year (Vendr, February 2026).
- Price your real viewer count and usage before you shortlist anything.
Quick Comparison: Embedded Analytics Tools at a Glance
The table below sums up all ten tools. "Starting cost" uses the vendor's published price where one exists. Where it doesn't, it uses the median annual contract from Vendr's purchase data.
| Tool | Best for | Embed method | Starting cost |
|---|---|---|---|
| Draxlr | SaaS teams on SQL databases that want to ship fast | iframe, React SDK, Vue SDK, JWT backend API | $75/month, unlimited viewers |
| Tableau | Enterprises already on Salesforce and Tableau | Embedding API v3, Connected Apps | Custom quote |
| Power BI Embedded | Microsoft and Azure shops | JavaScript SDK, REST API | ~$736/month (A1 node) |
| Looker | Google Cloud teams that need a governed semantic layer | Signed embedding, Embed SDK | Custom annual contract |
| Amazon QuickSight | AWS-native products with spiky usage | Embedding SDK, anonymous embedding | $250/month (500 sessions) |
| Sisense | Deep UI customization with code | Compose SDK, iframe | ~$56,831/year median |
| ThoughtSpot | Natural language search for end users | Visual Embed SDK | ~$100,000/year median |
| Qlik Cloud Analytics | Associative, exploratory analysis | qlik-embed web components | $2,750/month (Premium) |
| Domo Everywhere | Companies already running Domo | Embedded cards and dashboards | ~$50,000/year median |
| Sigma | Spreadsheet-style analysis on a cloud warehouse | Secure embed URLs | ~$66,540/year median; embedding needs Enterprise tier |
What Is Embedded Analytics?
Embedded analytics puts charts, dashboards and reports directly inside another application. That might be your SaaS product, a customer portal or an internal tool. Your users see their data in context, and they never log in to a separate BI tool.
A good embedded setup handles three jobs:
- Presentation. Dashboards match your product's look, with no vendor logo getting in the way.
- Isolation. Each customer sees only their own rows. That's usually done with a tenant filter or row-level security.
- Authentication. Your backend vouches for the logged-in user, often with a signed token, so viewers don't need separate accounts.
Anything short of all three means building the missing piece yourself.
1. Draxlr: Best Overall for SaaS Teams
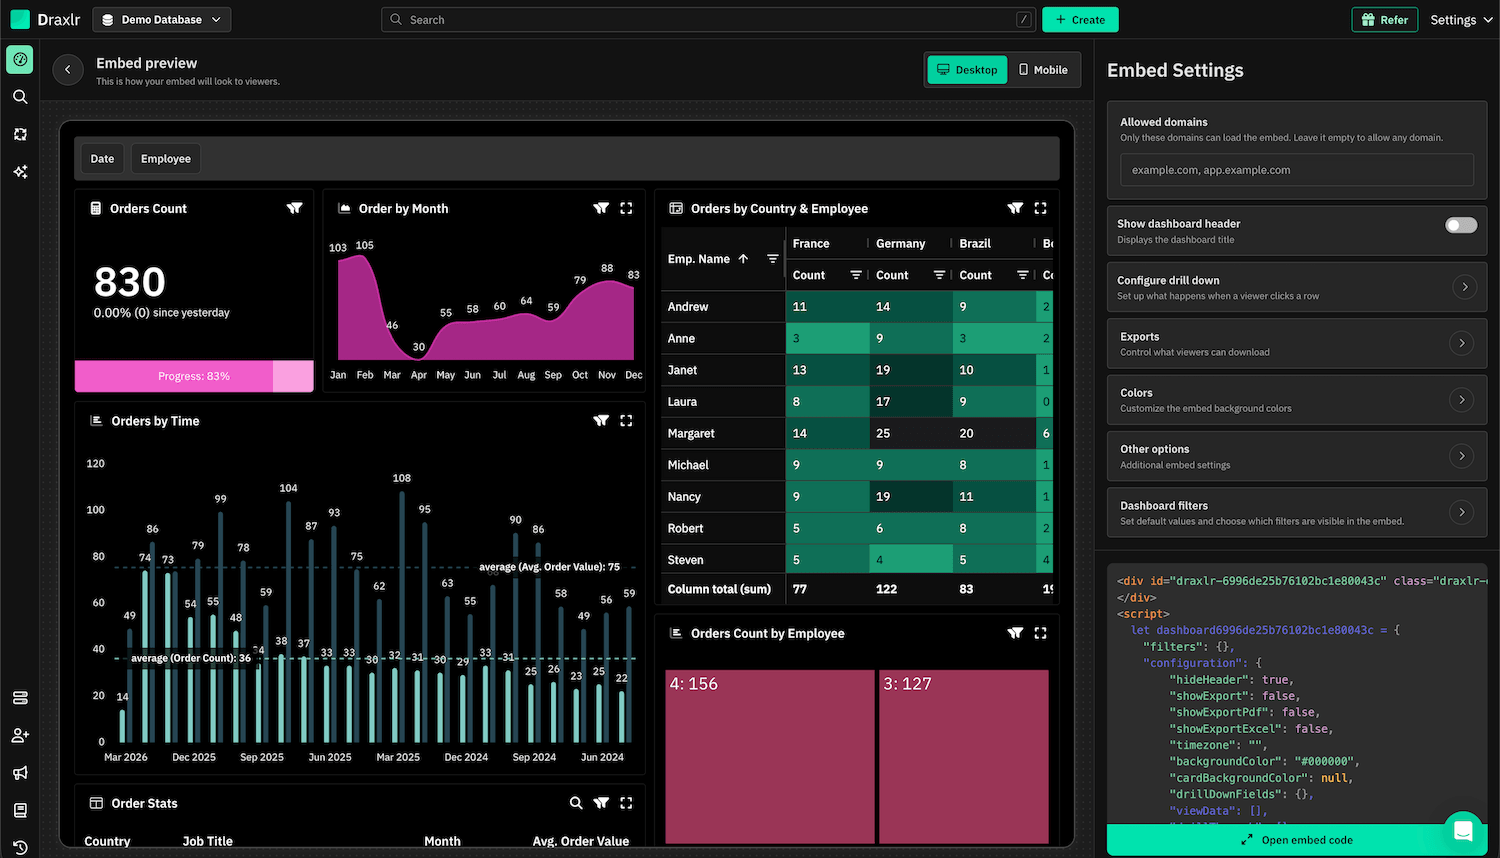
Draxlr is the only tool on this list that includes embedding in a self-serve plan with unlimited external viewers. The Premium plan costs $75 per month (Draxlr pricing). You connect a SQL database, build dashboards and paste an embed snippet into your app. There's no per-viewer license math.
Why it stands out:
- Flexible embedding. Embed with an iframe, the ReactJS SDK, the VueJS SDK or backend APIs. For secure embeds, your backend calls Draxlr's API with filters and gets back a JWT to inject into the page (Draxlr docs).
- Simple multi-tenancy. Add a hidden filter such as
AccountIdand pass the logged-in customer's value. Each tenant then sees only their own data. - Access control. A domain allowlist stops other sites from loading your embed code.
- Fits your product's look. You can hide the header, turn CSV export and drill-down on or off, and set the background color. White-label embeds, with no Draxlr branding, are included from the Premium plan up.
- Three ways to build. Create charts with AI, a visual query builder or raw SQL. Alerts and an MCP server are also included.
- Wide database support. It connects to PostgreSQL, MySQL, MariaDB, SQL Server, Supabase, PlanetScale, CockroachDB, YugabyteDB, ClickHouse, Redshift, BigQuery, Snowflake and Databricks.
Pricing: Premium is $75/month for 2 databases and 10 users, and Power is $125/month for 5 databases and 30 users. Both include dashboard embedding and white-label embeds. Enterprise starts at $500/month and adds full app embedding, self-hosting, SSO and audit logs. All plans include unlimited external viewers. You also get a 7-day free trial of Power with no credit card.
Watch out for: Draxlr is built for SQL databases and warehouses. If your data sits in spreadsheets or SaaS APIs, you'll need to load it into a database first.
Best for: SaaS startups and mid-size product teams that want customer-facing dashboards live in weeks, not quarters, without an enterprise contract.
2. Tableau: Best for Salesforce-Centric Enterprises
Tableau is the best-known name in data visualization. Its embedded offering is aimed at large companies that already run Tableau internally. Salesforce doesn't publish an embedded price. Instead, it offers usage-based licensing: external Usage Viewers are billed per "analytical impression" while Creators and Explorers stay per user (Tableau Help).
Why teams choose it:
- It has the deepest visualization toolkit of any tool here, plus a huge community.
- The Embedding API v3 and Connected Apps give you single sign-on and control over interactions.
- Usage-based licensing can make more sense than per-seat Viewer licenses when viewers log in rarely.
Pricing: Embedded is sales-led. You'll also need Creator licenses for the people building dashboards and a Tableau Cloud or Server deployment.
Watch out for: The total cost is hard to forecast before you sign. Styling embeds so they don't look like Tableau also takes real effort.
Best for: Enterprises with Tableau skills in-house and budget for a multi-year contract.
3. Microsoft Power BI Embedded: Best for Azure Shops
Power BI Embedded charges for dedicated capacity instead of per viewer. On Microsoft's retail price list, the smallest A1 node costs $1.0081 per hour in East US. That's about $736 a month if it runs all the time. An A6 node costs $32.25 per hour (Azure Retail Prices API, retrieved September 2026).
Why teams choose it:
- With the "app owns data" model, your customers don't need Power BI licenses.
- Row-level security is mature and well documented.
- Nodes can be paused, which helps if usage follows business hours.
Pricing: You pay per capacity node, billed hourly. Anyone publishing reports needs a Power BI Pro or Premium Per User license, but your customers need no license in the app-owns-data model (Microsoft Learn).
Watch out for: Choosing a node size is guesswork until real traffic arrives. An undersized node slows every customer's dashboards at once.
Best for: Products already hosted on Azure, with developers who know the Microsoft stack.
4. Looker: Best for a Governed Semantic Layer
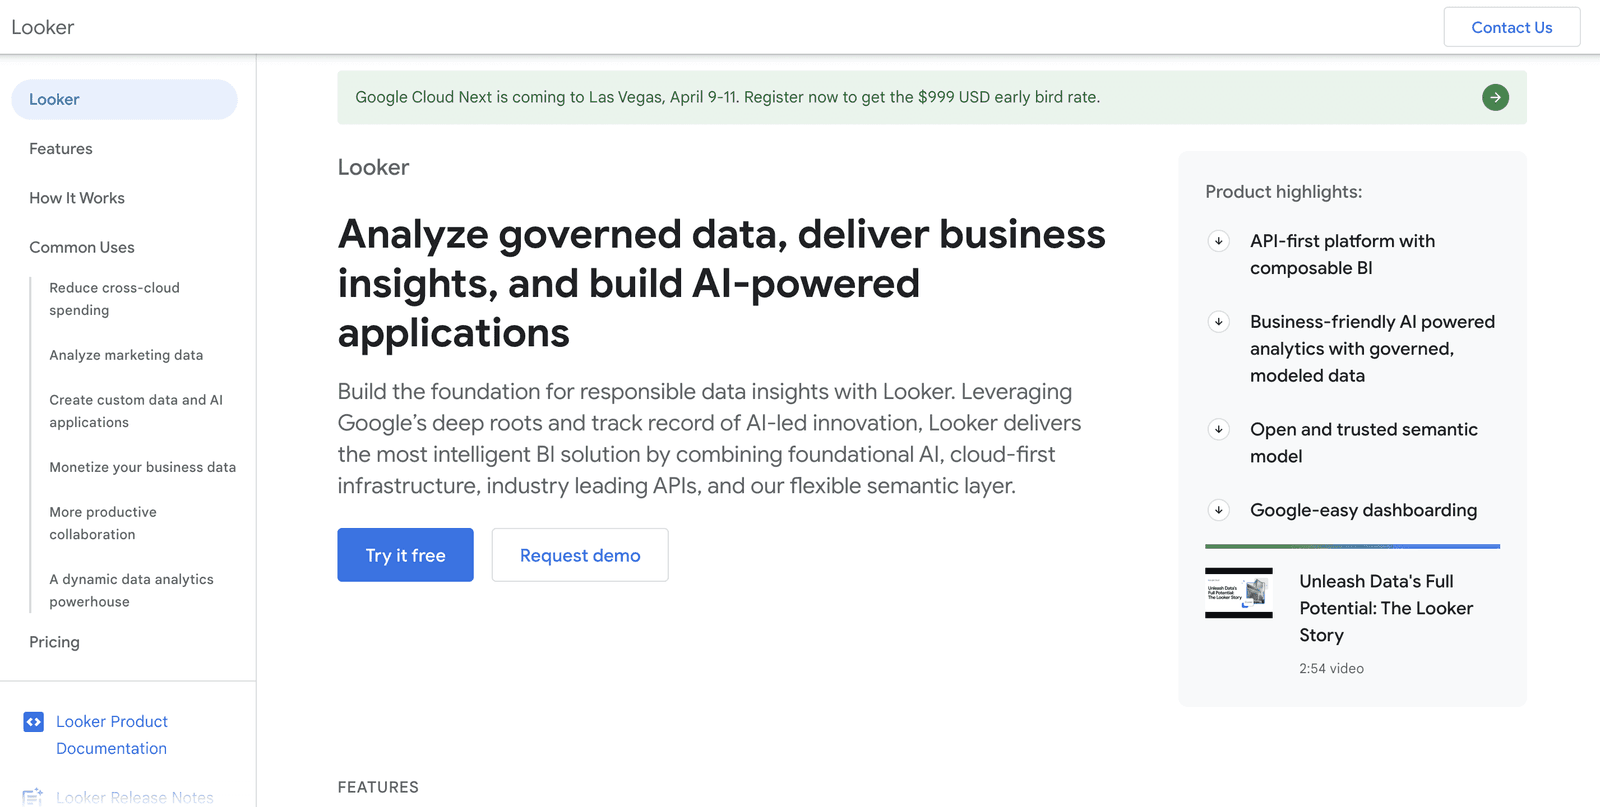
Looker, part of Google Cloud, sells a dedicated Embed edition. It adds signed embedding and custom themes, plus 500,000 query-related API calls and 100,000 admin API calls per month (Google Cloud docs). Every edition is sold on an annual contract, with no public price list.
Why teams choose it:
- LookML defines each metric once, so every customer sees the same logic.
- Queries run directly on your warehouse, with no extract to keep in sync.
- It integrates tightly with BigQuery and the rest of Google Cloud.
Pricing: You'll need a custom quote through Google Cloud sales. Plan for a separate non-production instance too, since Google recommends one for staging.
Watch out for: LookML has a real learning curve. The API call caps also matter once your embedded traffic grows.
Best for: Data teams with modeling skills that are already committed to Google Cloud.
5. Amazon QuickSight: Best for AWS-Native Products
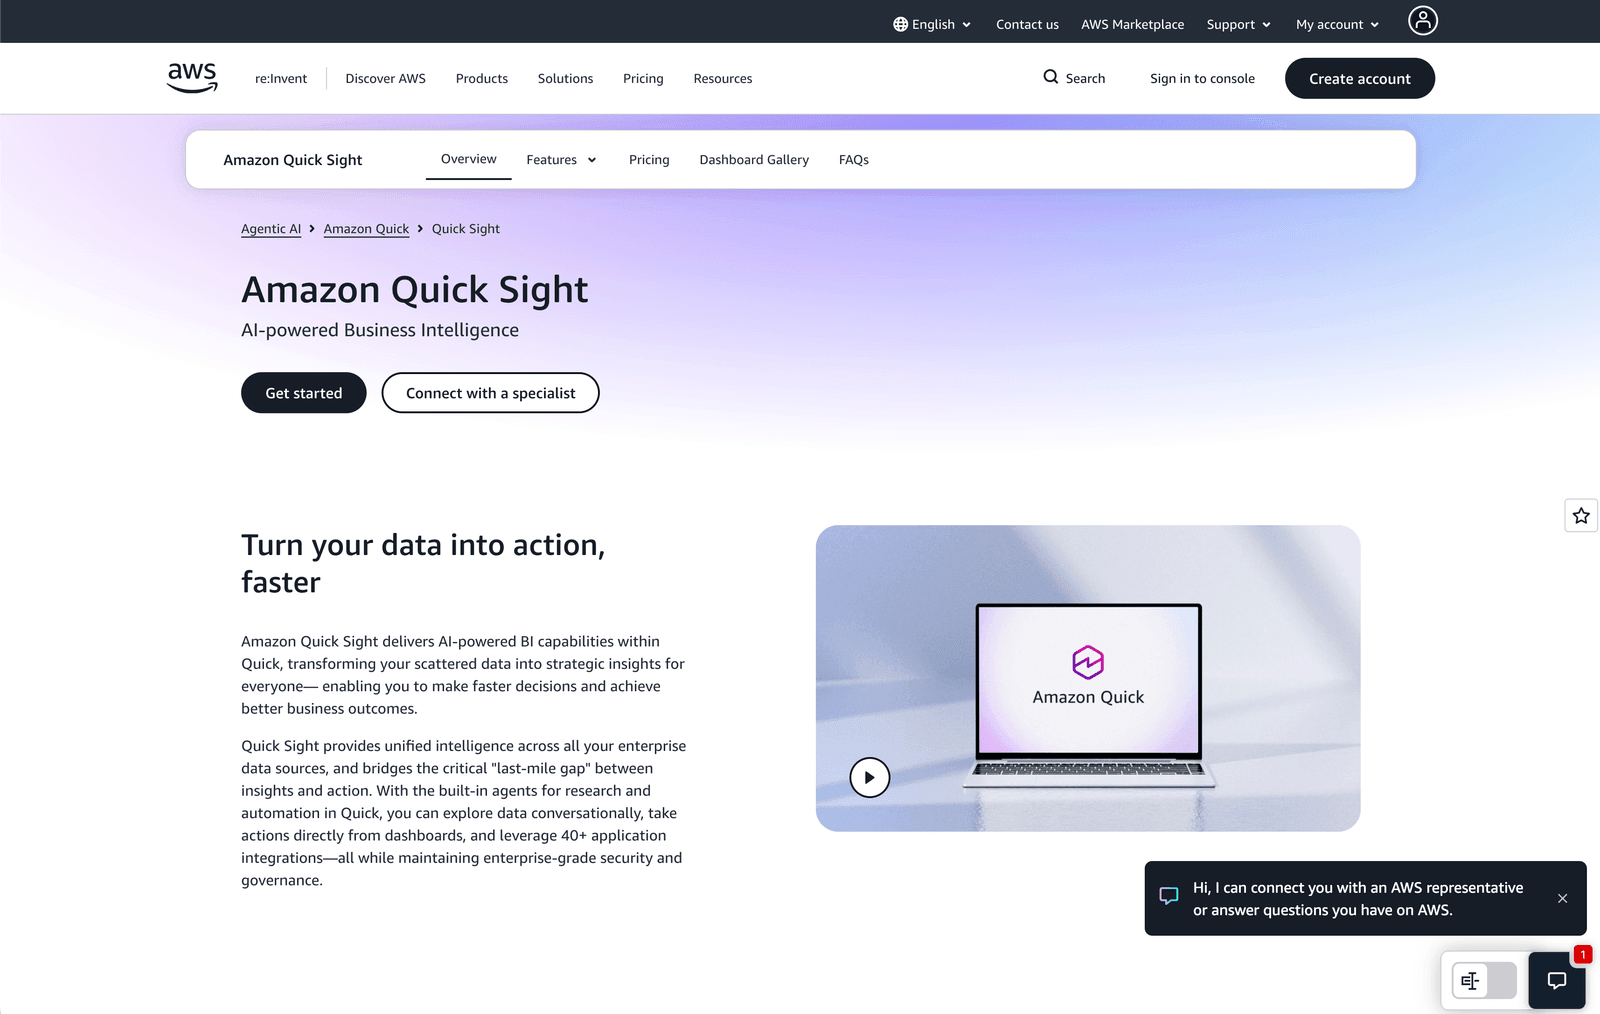
Amazon QuickSight, now branded Amazon Quick Sight, is the only enterprise tool here that publishes session-based embedded pricing. A monthly plan includes 500 reader sessions for $250 and charges $0.50 for each extra session. Annual plans start at $20,000 for 50,000 sessions, and each session lasts 30 minutes (AWS pricing).
Why teams choose it:
- Anonymous embedding means you don't have to create a user for every viewer.
- It connects natively to Redshift, Athena, S3 and RDS.
- Pay-per-session pricing suits products with occasional, bursty usage.
Pricing: Authors cost $24/user/month and Readers $3/user/month. Reader capacity runs from $250/month up to $258,000/year for 1.6 million sessions.
Watch out for: Customization is more limited than with SDK-first tools. A $250/month account fee also applies if you enable Pro users or Q&A.
Best for: Teams whose data and infrastructure already live in AWS.
6. Sisense: Best for Code-Level Customization
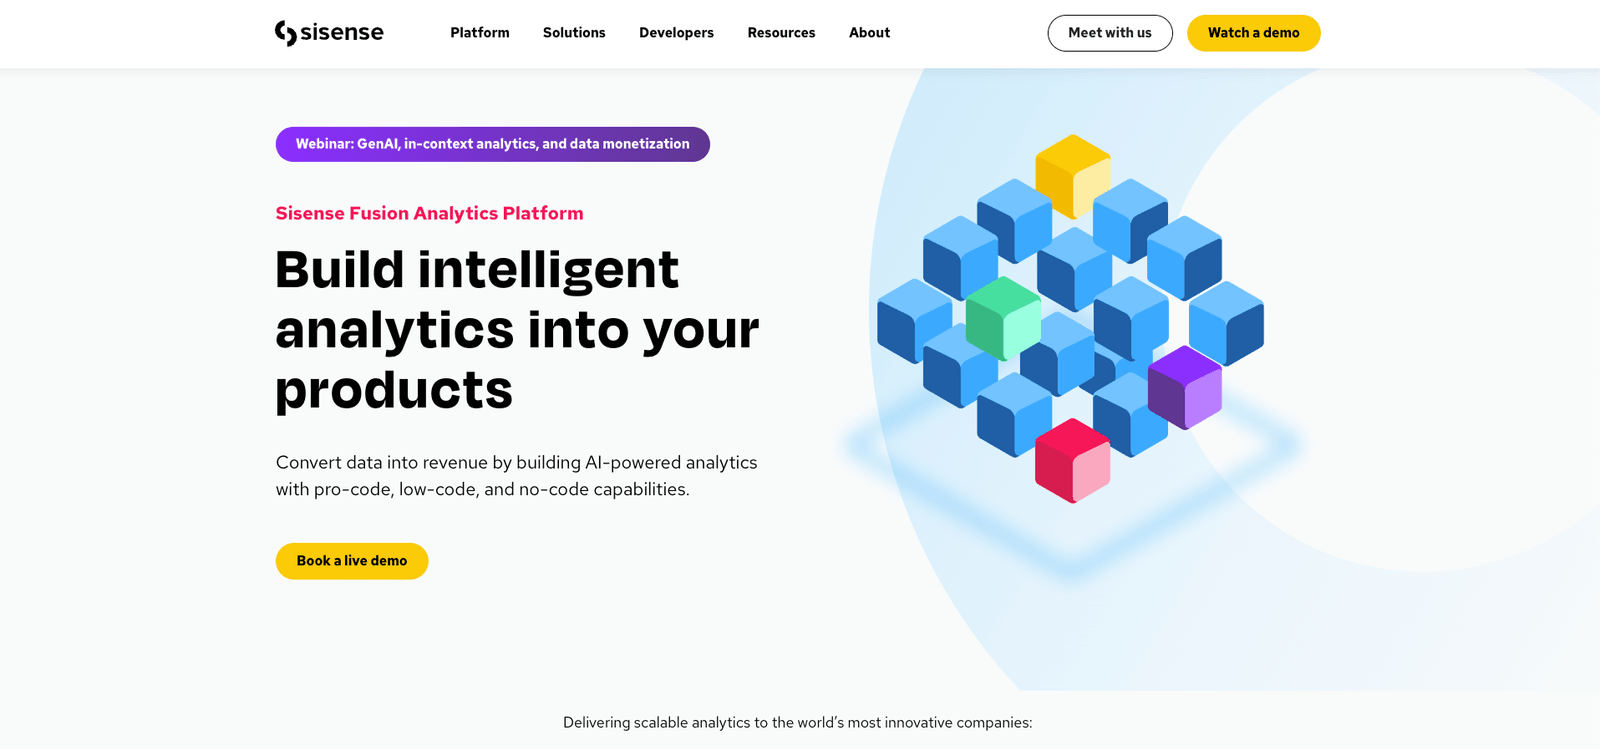
Sisense has served the embedded market for years. Its Compose SDK lets developers build analytics from React, Angular or Vue components instead of dropping in an iframe. Sisense doesn't publish prices. Vendr's data from 126 purchases shows a median annual contract of $56,831 (Vendr).
Why teams choose it:
- The Compose SDK gives front-end developers component-level control.
- It can join data from multiple sources in its own data layer.
- It has a long track record with software vendors that embed analytics.
Pricing: Custom quotes. In Vendr's data, contracts ranged from $18,139 to $178,681 a year.
Watch out for: Implementation often needs professional services, and the total cost climbs with data volume.
Best for: Product teams with front-end engineers who want analytics to feel fully native.
7. ThoughtSpot Embedded: Best for Natural Language Search
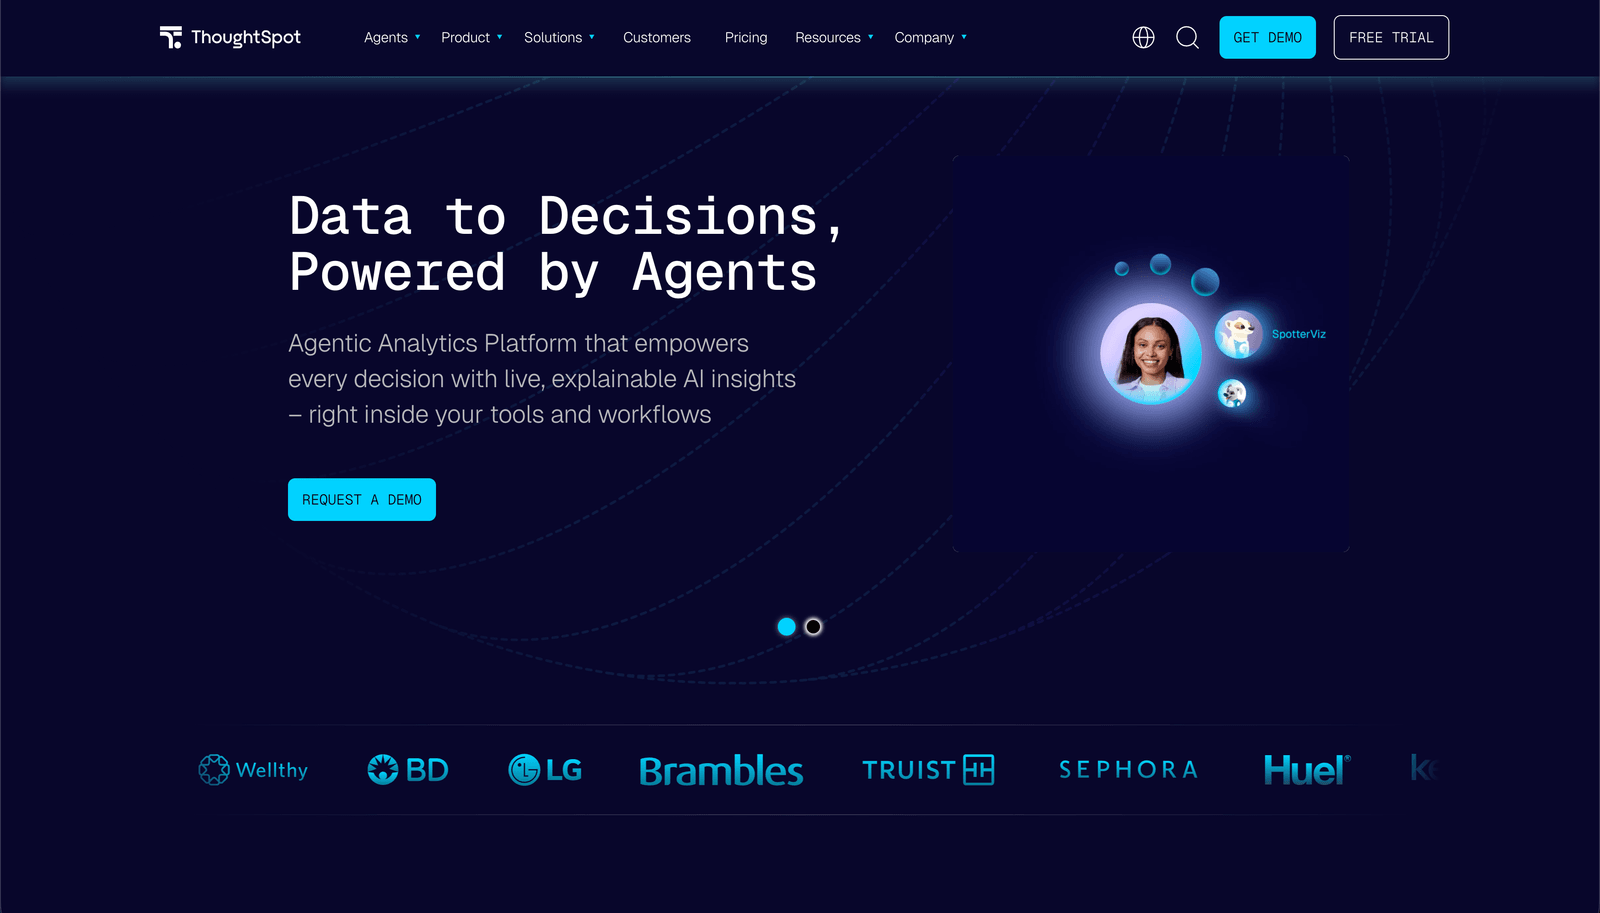
ThoughtSpot lets end users type questions in plain English and get charts back. Its Developer plan is free for one year, for up to 10 users and 25M rows. Production embedding runs on a custom-priced Enterprise Embedded plan (ThoughtSpot pricing). According to Vendr, the median buyer pays $100,000 a year.
Why teams choose it:
- Spotter, its AI agent, answers questions in natural language, and LLM tokens aren't billed separately.
- The Visual Embed SDK can embed search, single charts or full Liveboards.
- It queries cloud warehouses such as Snowflake and Databricks live.
Pricing: The Developer plan is free for a year. Enterprise Embedded is custom-priced. Vendr's reported contracts range from $38,640 to $221,653.
Watch out for: ThoughtSpot's Essentials, Pro and Enterprise analytics plans don't include embedding, so internal BI and customer-facing embedding are separate purchases.
Best for: Well-funded products where self-service questions matter more than fixed dashboards.
8. Qlik Cloud Analytics: Best for Exploratory Analysis
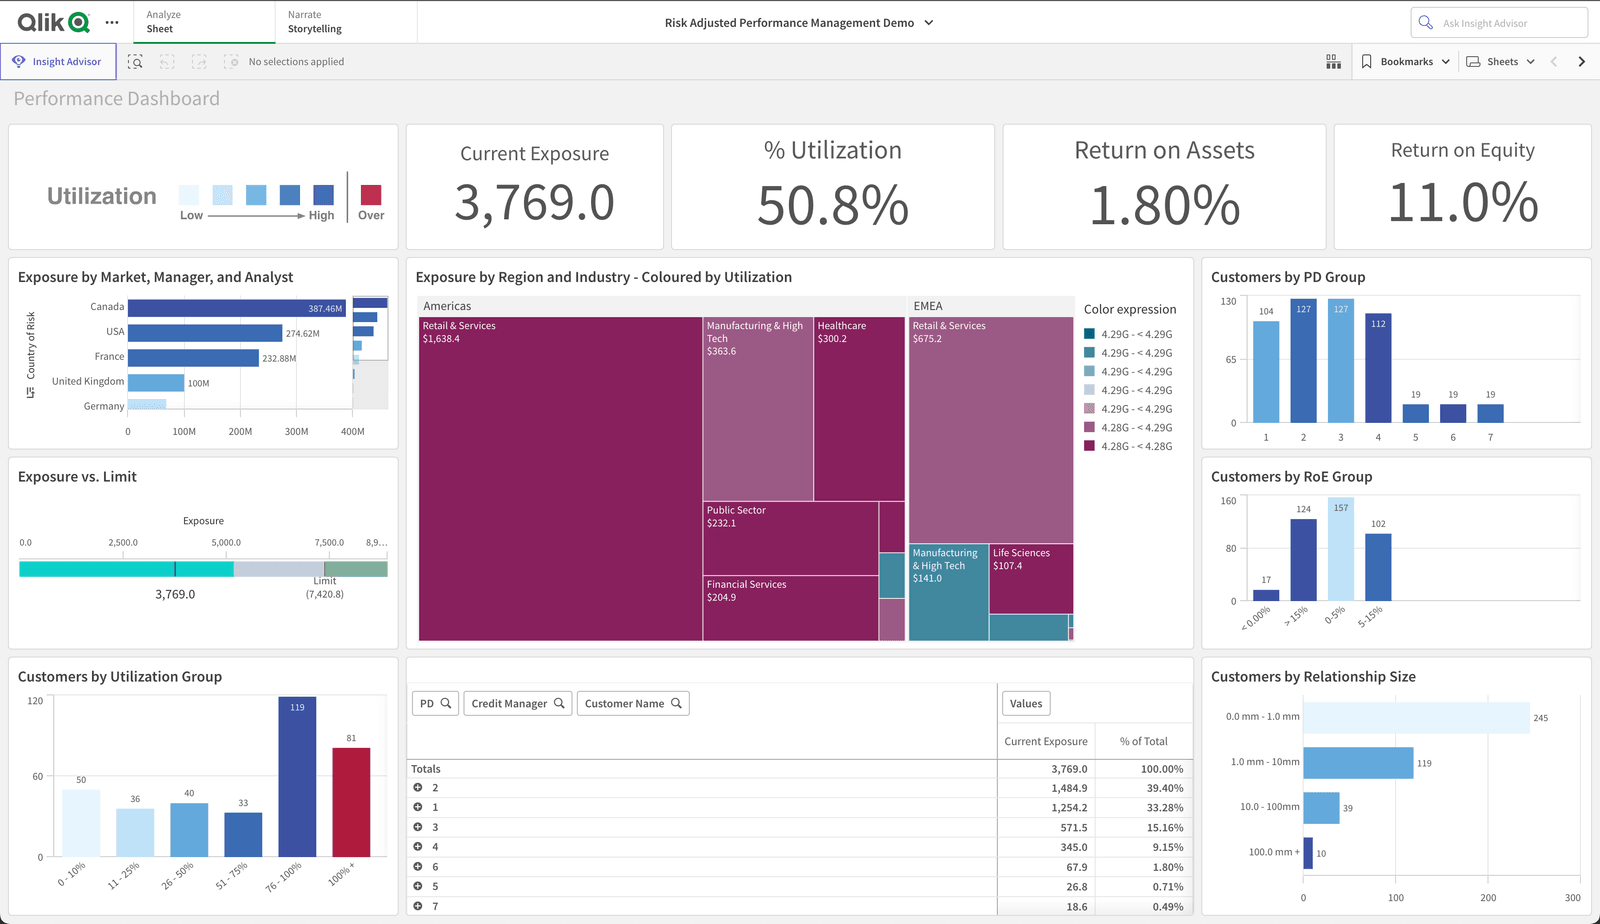
Qlik's associative engine lets users click through linked data freely instead of following a fixed drill path. Anonymous (public) access, which customer-facing embeds often need, starts with the Premium plan. Premium costs $2,750 per month, billed annually, with 50 GB of data (Qlik pricing).
Why teams choose it:
- Associative exploration shows related and unrelated values at a glance.
- The qlik-embed web components work with modern front-end frameworks.
- It has strong data integration through the Qlik Talend portfolio.
Pricing: Premium is $33,000 a year. OEM and external-user arrangements are priced separately through sales.
Watch out for: Pricing is tied to data capacity, so costs grow as your data grows. The scripting language also takes time to learn.
Best for: Analytics-heavy products whose users explore data rather than just check KPIs.
9. Domo Everywhere: Best for Existing Domo Customers
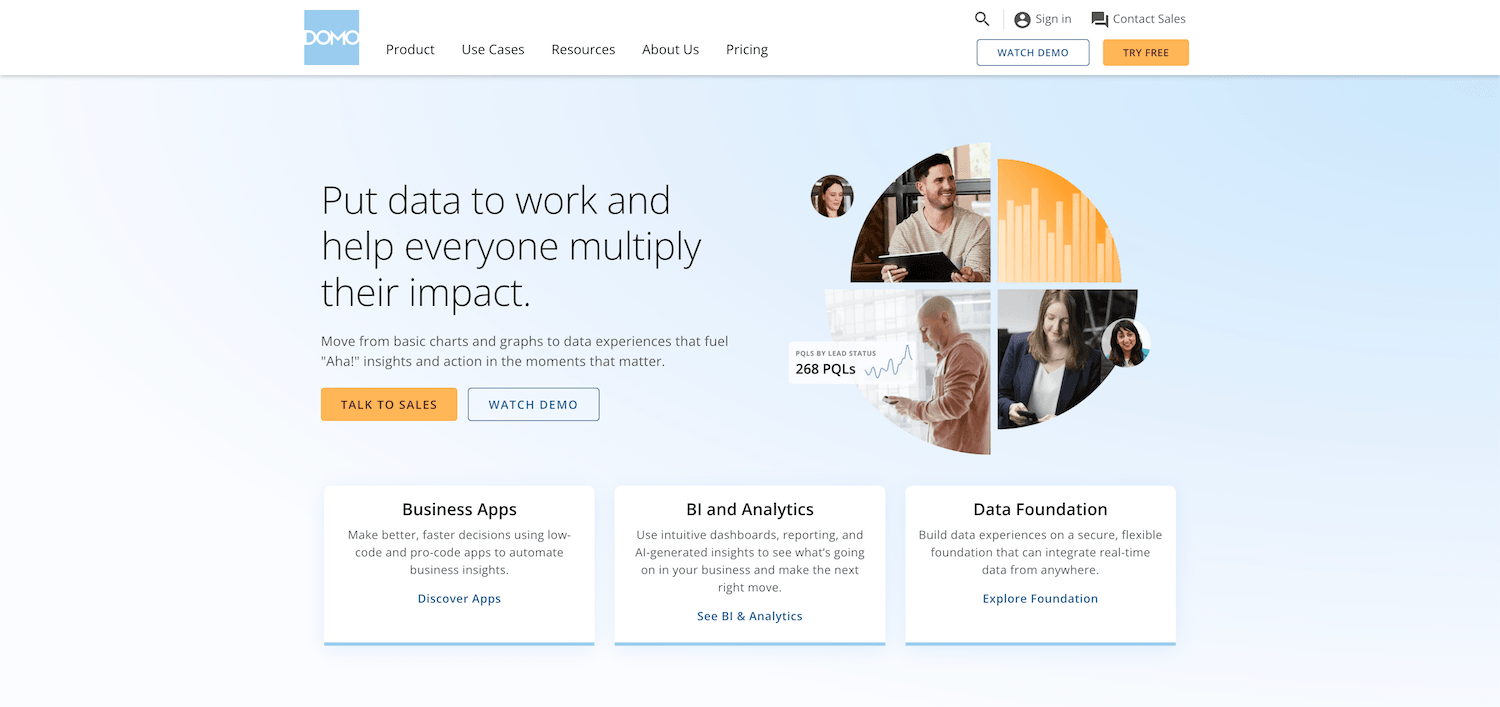
Domo Everywhere is Domo's embedded and white-label offering. It shares dashboards externally from the same platform your internal teams use. Domo uses consumption-based credit pricing and doesn't list embedded rates (Domo pricing). Vendr reports a median contract of $50,000 a year across 91 purchases.
Why teams choose it:
- It bundles ETL, data connectors and dashboards in one platform.
- Its broad connector library covers SaaS apps as well as databases.
- It can publish to partners and customers from a single instance.
Pricing: Custom, credit-based consumption pricing. Vendr's reported contracts range from $10,920 to $175,245.
Watch out for: Credit consumption is hard to predict once external users start querying at scale.
Best for: Organizations already standardized on Domo that want to extend it to customers.
10. Sigma: Best for Spreadsheet-Style Analysis on a Warehouse
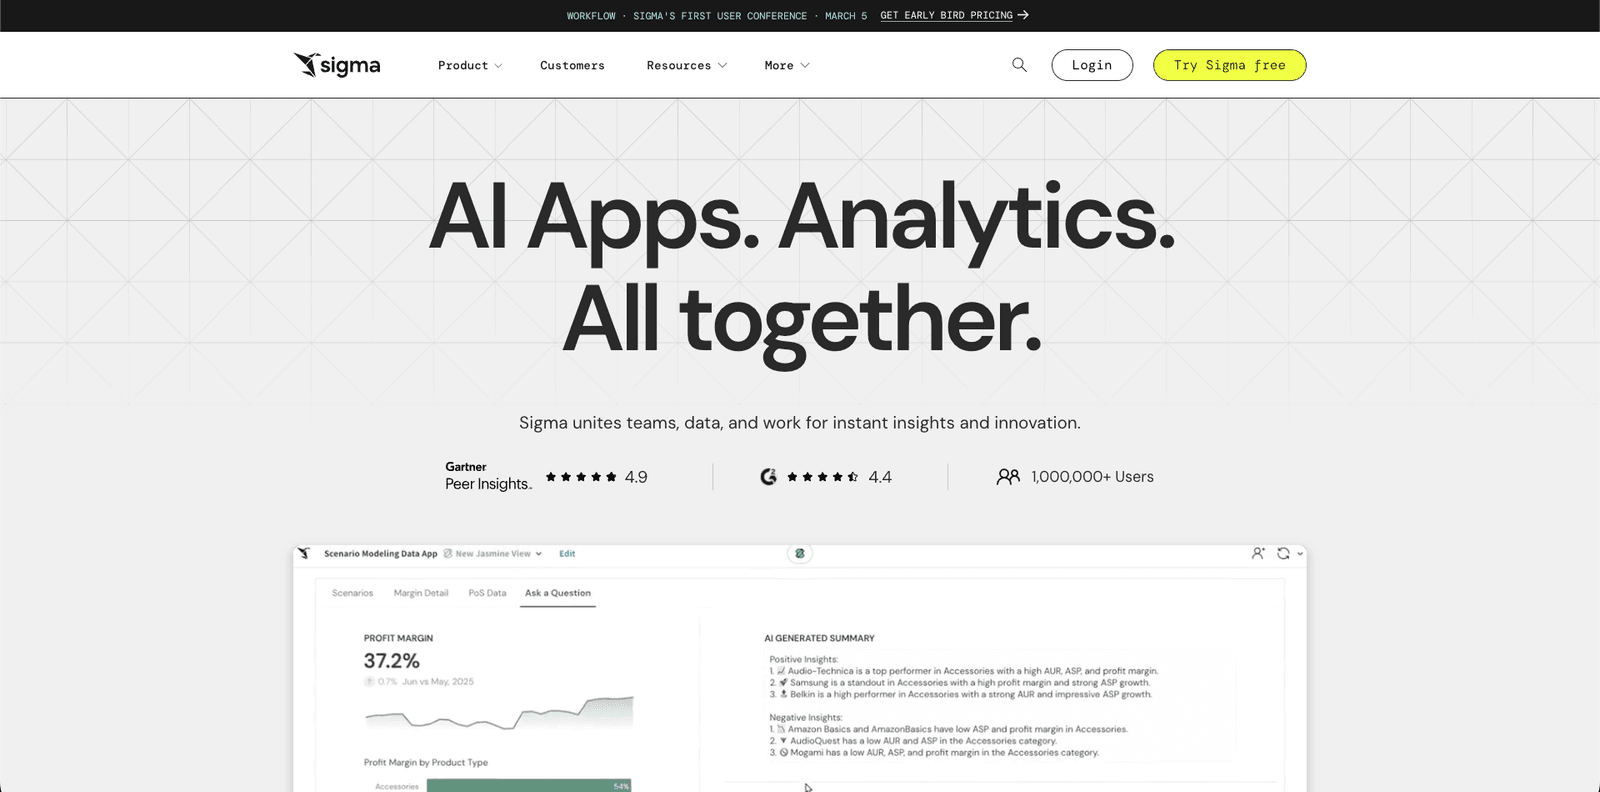
Sigma gives users a familiar spreadsheet interface on top of Snowflake, Databricks or BigQuery. Sigma doesn't publish pricing. Across 152 purchases, Vendr reports a median contract of $66,540 a year (Vendr).
Why teams choose it:
- Business users already know how to use a spreadsheet.
- Everything runs live on your cloud warehouse, with no extracts.
- With input tables, embedded users can write data back to your warehouse, not just view it.
Pricing: Custom quote. Vendr's buyer data ranges from $17,500 to $147,142 a year, but Vendr notes embedding is only available on the Enterprise tier, where customer-facing contracts often start around $100,000.
Watch out for: Every embedded interaction runs a query on your warehouse, so those compute costs add to the license fee.
Best for: Companies whose data already lives in a modern cloud warehouse.
How Much Does Embedded Analytics Really Cost?
Costs range from under $1,000 to more than $100,000 a year. Draxlr's Premium plan works out to $900 a year. Vendr puts the median ThoughtSpot contract at $100,000 and the median Sigma contract at $66,540. Six of the nine enterprise tools here don't publish a price at all.
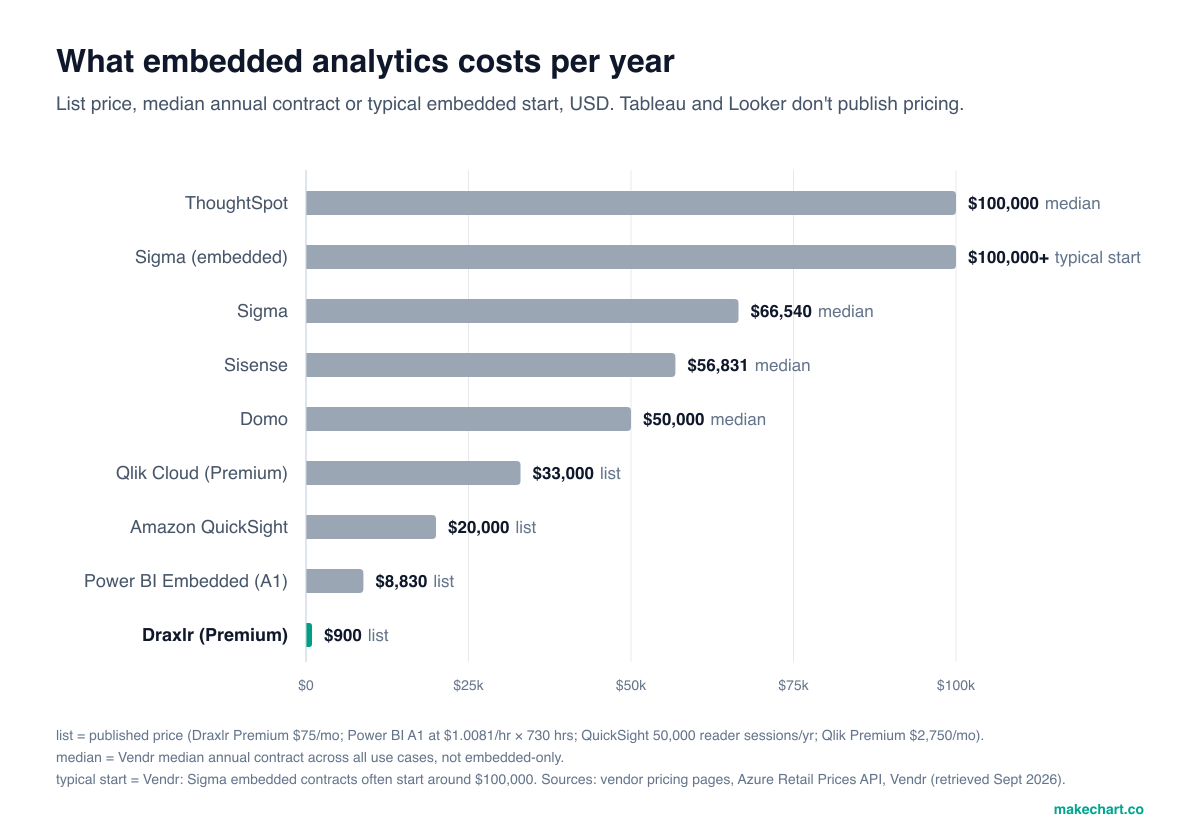
Read the chart with one caveat: Vendr medians cover whole-platform contracts, not only embedding. Embedded deals can cost more. Vendr notes Sigma's customer-facing embedded contracts often start around $100,000. Even so, the gap is too wide to be a rounding error.
Three pricing models drive most of the difference:
- Per viewer. Every customer login adds cost. That's fine for 20 users and painful for 20,000.
- Capacity or sessions. Power BI and QuickSight bill for compute or sessions. Costs are predictable at steady traffic, but you have to size them.
- Flat plan with unlimited viewers. Draxlr charges by databases and builder seats, so viewer growth doesn't change the bill.
Before any demo, estimate three numbers: monthly active viewers, how often each one opens a dashboard, and how many people will build dashboards.
How to Choose the Right Embedded Analytics Tool
Start with where your data lives and how many people will view dashboards. Then check the rest:
- Data source. If you run PostgreSQL, MySQL or a warehouse, a SQL-first tool like Draxlr gets you live fastest. If you're deep in Azure, AWS or Google Cloud, their native tools cut integration work.
- Viewer economics. Project your viewer count 24 months out and price it under each model. Per-viewer pricing punishes growth.
- Tenant isolation. Confirm how the tool keeps Customer A from seeing Customer B's data: hidden filters, row-level security or signed tokens.
- Look and feel. Check that you can remove vendor branding and match your fonts and colors on the plan you'll actually buy.
- Time to launch. Ask whether you need professional services. For some enterprise tools, a paid services package is normal.
Planning the charts themselves? Our guide to types of charts explains which visualization fits each metric. You can also mock up ideas with the free MakeChart chart generator.
How We Selected These Tools
We picked Draxlr plus nine well-known enterprise platforms with dedicated embedded offerings. Smaller and open-source tools were left out on purpose, since this list compares the costly incumbents with an affordable alternative.
We compared each tool on five points:
- Embedding methods: iframe, SDKs, APIs and secure token support
- Multi-tenant security: how per-customer data isolation works
- Published pricing: list prices where available, otherwise Vendr's buyer-reported contract data
- Ecosystem fit: which cloud and data stack each tool assumes
- Customization: theming and white-label options
Pricing was checked against vendor pages, Microsoft's retail price API and Vendr in September 2026. Prices change often, so confirm with each vendor before you buy.
Disclosure: MakeChart is built by the team behind Draxlr.
Sources
- Fortune Business Insights, Embedded Analytics Market Size, Share & Growth Report, retrieved 2026-09-14, https://www.fortunebusinessinsights.com/embedded-analytics-market-108883
- Draxlr, Pricing, retrieved 2026-09-14, https://www.draxlr.com/pricing/
- Draxlr Docs, Dashboard > Embed, retrieved 2026-09-14, https://docs.draxlr.com/docs/dashboard/embed-dashboard
- Draxlr, Embedded Analytics Tool for SaaS Products, retrieved 2026-09-14, https://www.draxlr.com/embedded-analytics-tool/
- Tableau Help, Understanding License Models (usage-based licensing), retrieved 2026-09-14, https://help.tableau.com/current/online/en-us/license_product_keys.htm
- Microsoft, Azure Retail Prices API (Power BI Embedded, East US), retrieved 2026-09-14, https://prices.azure.com/api/retail/prices
- Google Cloud, Looker (Google Cloud core) overview, retrieved 2026-09-14, https://docs.cloud.google.com/looker/docs/looker-core-overview
- Amazon Web Services, Amazon QuickSight Pricing, retrieved 2026-09-14, https://aws.amazon.com/quick/quicksight/pricing/
- ThoughtSpot, Plans and Pricing, retrieved 2026-09-14, https://www.thoughtspot.com/pricing
- Qlik, Qlik Cloud Analytics Pricing, retrieved 2026-09-14, https://www.qlik.com/us/pricing
- Microsoft Learn, Capacity and SKUs in Power BI embedded analytics, retrieved 2026-09-14, https://learn.microsoft.com/en-us/power-bi/developer/embedded/embedded-capacity
- Domo, Consumption-based Pricing, retrieved 2026-09-14, https://www.domo.com/pricing
- Sigma, Embedded Analytics and Apps, retrieved 2026-09-14, https://www.sigmacomputing.com/product/embedded-analytics
- Vendr, Sisense / ThoughtSpot / Domo / Sigma pricing data (last updated February 2026), retrieved 2026-09-14, https://www.vendr.com/marketplace
Frequently Asked Questions
What is the best embedded analytics tool in 2026?
For most SaaS teams on a SQL database, Draxlr is the best embedded analytics tool in 2026. Embedding starts at $75/month with unlimited external viewers, JWT-secured embeds and React and Vue SDKs. Enterprises tied to one cloud may prefer Power BI Embedded, Looker or Amazon QuickSight.
How much does embedded analytics cost?
Embedded analytics costs anywhere from about $900 a year to more than $100,000. Draxlr Premium is $75/month. Power BI Embedded's A1 node runs about $736/month, and QuickSight annual capacity starts at $20,000. Vendr reports median contracts of $56,831 for Sisense and $100,000 for ThoughtSpot.
What is the difference between embedded analytics and traditional BI?
Traditional BI is a separate application that internal analysts log in to. Embedded analytics puts dashboards inside your own product, so customers see their data in context without another login. Embedded tools add multi-tenant data isolation, token-based authentication and white-label styling, which standard BI licenses usually don't include.
Can I embed dashboards without paying per viewer?
Yes. Draxlr includes unlimited external viewers on every plan, and embedding starts at $75/month. Power BI Embedded bills per capacity node instead of per user, and Amazon QuickSight bills per 30-minute reader session. Tableau's usage-based licensing charges for Analytical Impressions rather than named Viewer seats.
How do embedded dashboards keep customer data separate?
Most tools pass the logged-in customer's identity from your backend to the analytics layer. In Draxlr, you add a hidden filter such as AccountId and set its value in a JWT your server requests. Power BI and Looker use row-level security or signed embed URLs to apply the same restriction.